Your best sit window, calculated.
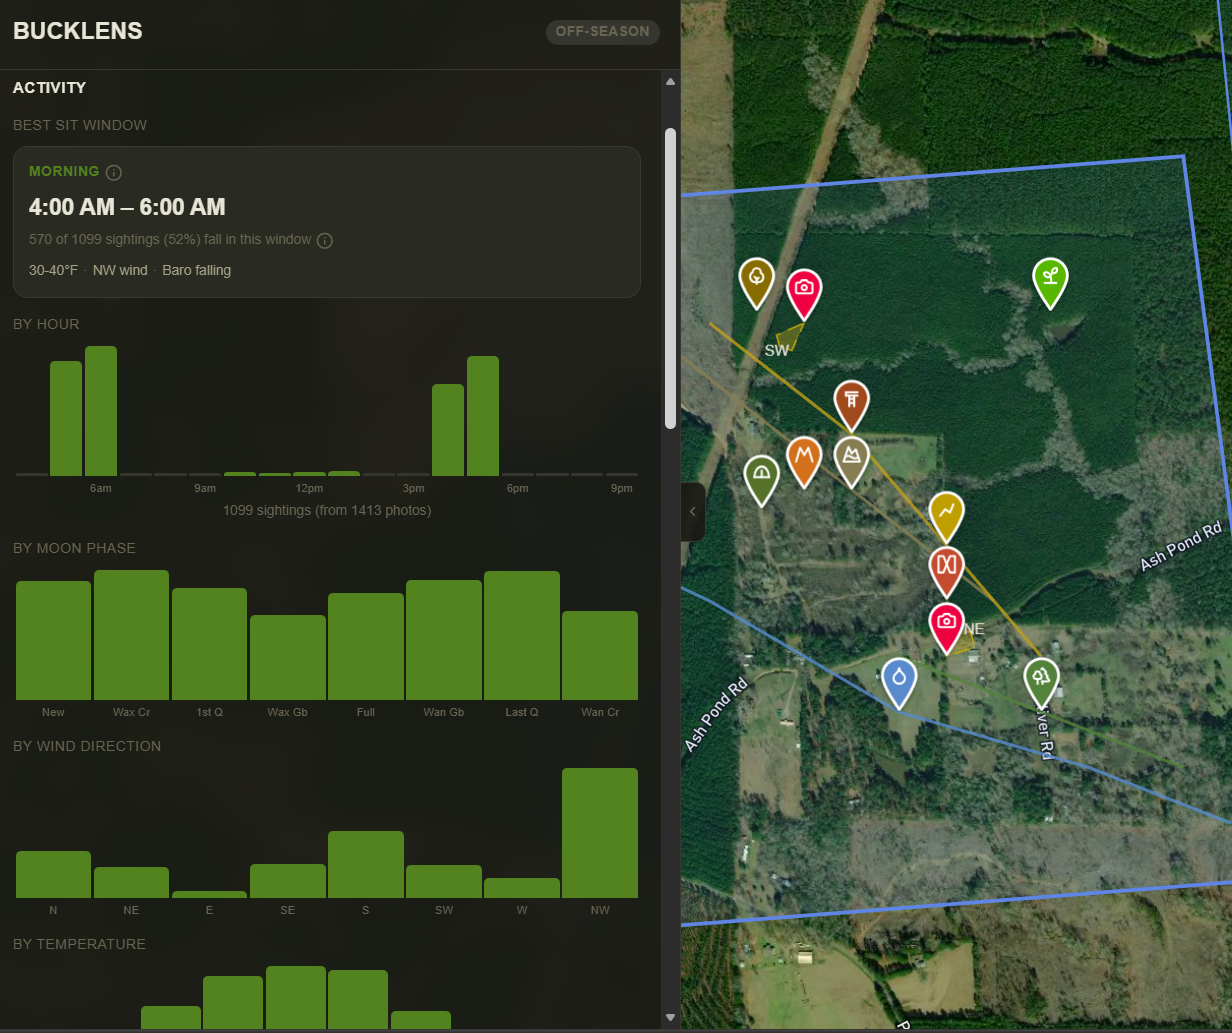
BuckLens analyzes every sighting and finds the peak activity window for each camera. Not a generic "dawn and dusk" — the actual 2-hour block when deer move through that specific camera, under the conditions that produce the most sightings on your ground.
- Peak activity window per camera with exact time range
- Sighting count and confidence percentage
- Optimal weather conditions — wind, temp, barometric pressure
- Multi-variable fusion — when multiple conditions align, BuckLens tells you exactly
Break down activity six ways.
Every dimension of deer movement, visualized from your own data. By hour, moon phase, wind direction, temperature, barometer trend, and camera rankings — all built from your trail cam history, not averages.
- By Hour — exact hourly distribution per camera
- By Moon Phase — see if your deer are moon-driven
- By Wind Direction — 8 cardinal directions correlated with sightings
- By Barometer Trend — rising, falling, or steady
Which camera earns its keep — and when.
As the season progresses, deer change their patterns. The camera that's hot in early season may go cold once the rut kicks in. BuckLens builds a camera-by-season-phase matrix so you know where to focus as conditions change.
- Cameras × season phases matrix with color-coded intensity
- Spot rut hotspots vs late-season patterns instantly
- Available at Doe tier and above
Oak Flat and Creek Crossing peak during rut. Food Plot dominates early and late season.